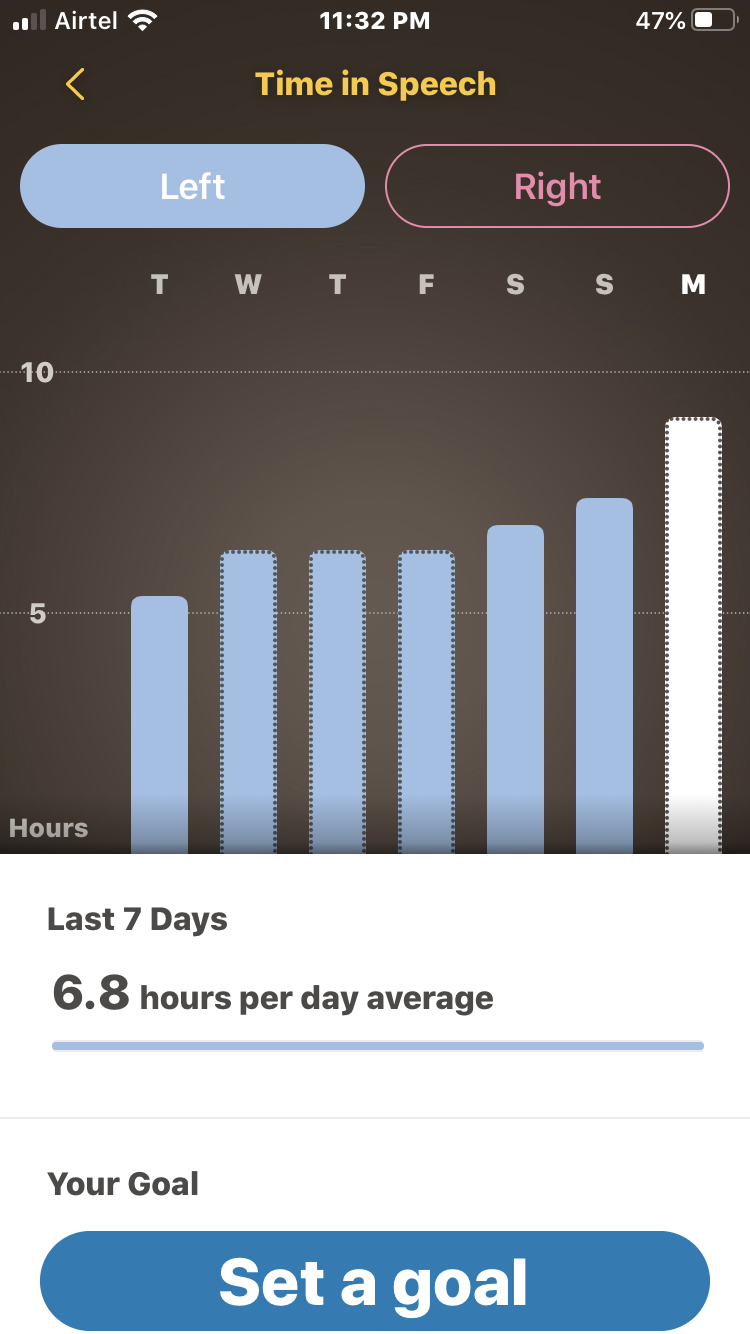


Figure 13.1 A screenshot from the Cochlear App, dated August 15, which features a bar graph of time spent in speech for the last seven days, from Tuesday to Monday, with time in speech ranging from five to nine hours on each day. On the bottom of the screen, it says that the average over the last seven days is 6.8 hours.

Figure 13.2 A screenshot from the Cochlear App, dated August 30, which features a bar graph of time spent in speech for the last seven days, from Wednesday to Tuesday, with time in speech ranging from approximately 1.75 hours to 3.75 hours. On the bottom of the screen, it says that the average over the last seven days is 3.1 hours.